Introduction
This article is a little step sideways from the recent articles looking at some of the data coming out of the Olympics. The aside is prompted by an ongoing question I’ve had about penalty corners which I was reminded about during a talk on Ernst Baart’s Hockey Site that Fede Tanuscio gave back in June. It wasn’t the talk so much (which I discussed a little here) but a small side commentary that occurred discussing the merits or otherwise of reaward penalty corners.
The little side discussion caught my attention because as a coach I find that I get particularly ‘twitchy’ when my team has to face a reaward corner. The first corner the team has to defend is bad enough but for some reason I get much more nervous if the players give away a reaward and even more nervous with each subsequent reaward.
This twitchiness comes about because I feel that there is a higher probability of a reaward corner being scored than the initial corner awarded.
‘Feel’ is the point to note here. I feel we are more likely to concede a goal from a reaward (and I bore the other coaching staff to tears with my expectation) but I don’t actually ‘know’ that this is the case. My impression falls into the same category as the feeling that there is a benefit to going first in a shoot out (which I addressed here and here). On the surface there appears to be some rationale for expecting a particular outcome. Going first (and of course scoring) forces the other team to always be ‘catching up’ in a shootout. In a similar way, a reaward gives the attacking team an advantage by being able to respond to anything they see in the defenders setup.
But, as the result of the shootout analysis shows, feelings are not a good way of assessing performance because they allow all our inherent biases, neuroses and psychological ticks to influence how we assess the outcome of a particular event (all coaches should read this book if you have any doubt about this). A proper statistical analysis would take care of all this and indeed it is a relatively simple question to ask an analytic framework to answer.
Defining the question.
The question to ask is, should I be nervous? Am I right to think that the probability we will concede a goal from a rewarded corner is higher than the first corner? There are three possible outcomes.
1. Reaward corners are scored at a higher rate than the first corner. Maybe the attackers gain some benefit from seeing the defending setup
2. Reaward corners are scored at lower rate than the first corner awarded. Perhaps the defenders gain some benefit from seeing the attacking setup.
3. There is no difference in scoring rates between the first corner awarded and reawards. Corners are like coin tosses, the probability of scoring does not change from corner to corner even if that corner is a reaward.
Because corners are relatively rare and one tournament might not provide enough data for an analysis to come to a definitive answer we need to put together corners from a range of tournaments, separate out the reaward corners from the first corners, do the various comparisons that arise and then, voila! we should have an answer.
The tournament data.
All the data comes from the women’s game and and is drawn from two Eurohockey tournaments (2021, 2023), two ProLeague competitions (2022-23, 2023-24), two Olympic Games (2020, 2024) and the World Cup (2022 )
The dataset then is seven different tournaments with a total of 254 matches (data wasn’t available for all games in some of these tournaments) involving twenty different teams who generated 2317 penalty corners between them. A very reasonable sample size and one that should allow us some confidence in whatever results come out.
Exploratory analysis.
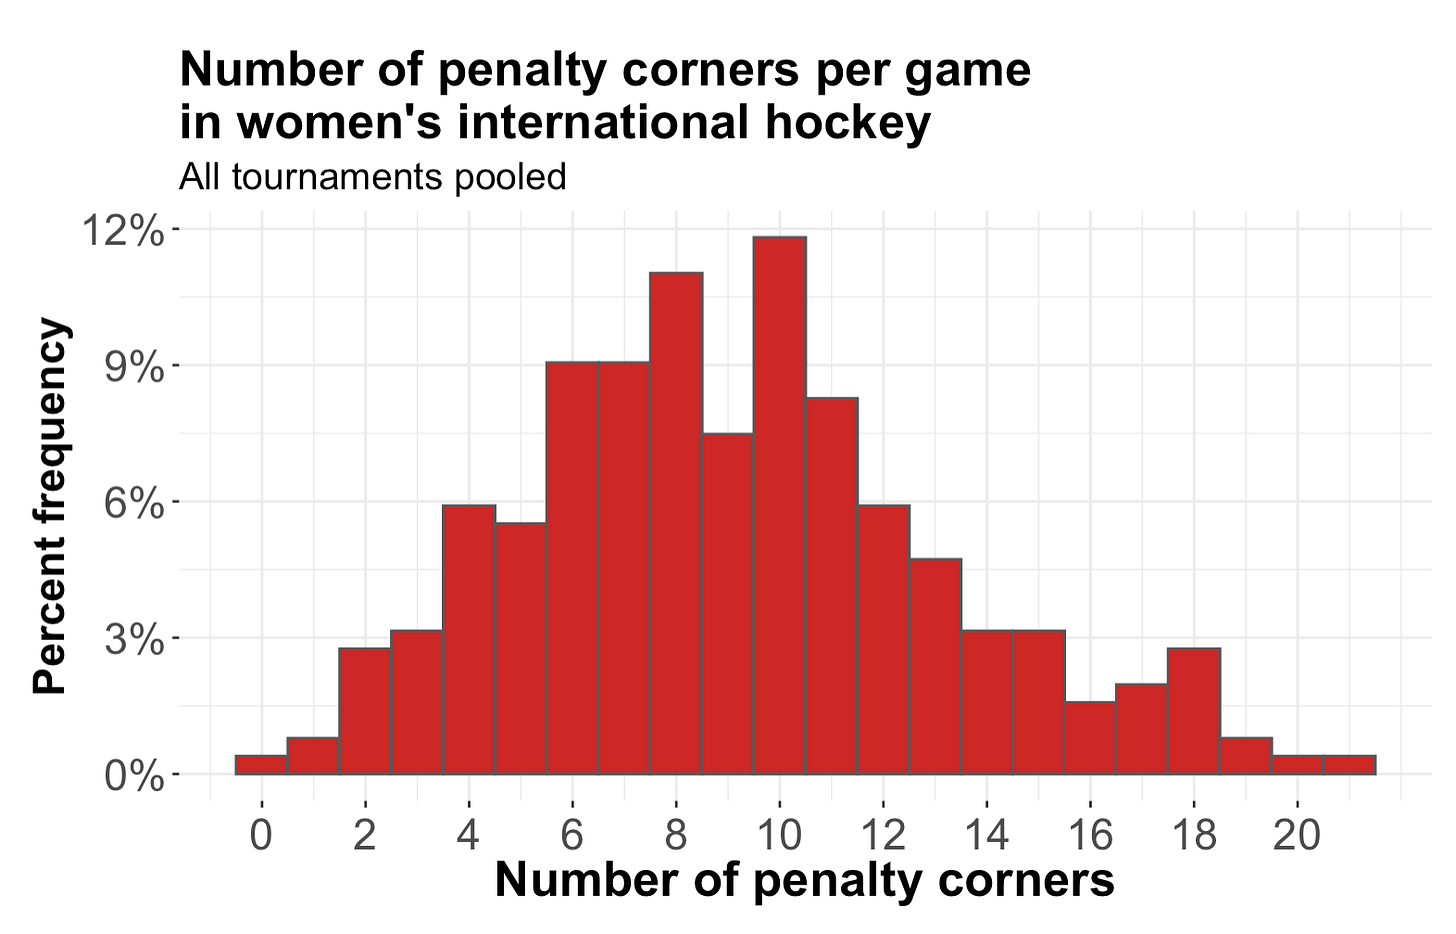
A little pre-analysis shows that the number of penalty corners per game across these tournaments is not different so we can pool the four competitions into one larg group. Then the first thing to do is get a general idea of the frequency of penalty corners in women’s international hockey.
Nearly a third of all games have between eight and ten corners with an average of about nine corners a game. Remember this is both teams in each game combined as well as first corners and any reawards.
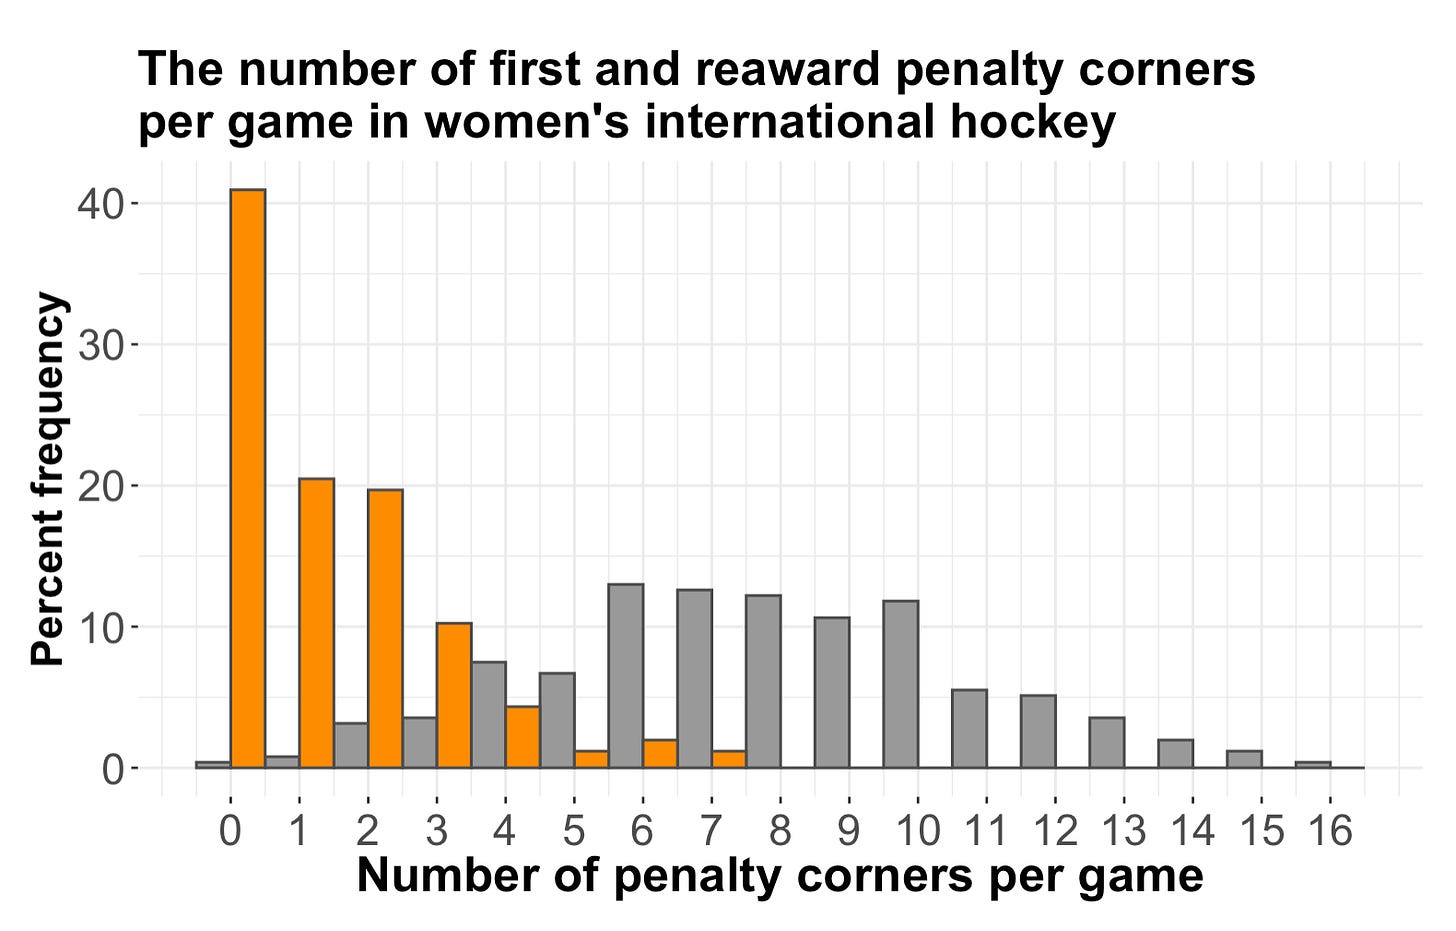
Dividing out these corners into first award and reawards we find that 253 of the 254 games (99.6%) had at least one first award corner. 150 of these games (59%) had at least one reaward corner. So, considerably fewer reawards but that shouldn’t be too much of a surprise given the nature of first and reawards - you have to have one before you can have the other.
How are the two corners types distributed?
There’s a fairly even distribution of first corners - between six and ten a game with an average of 7.8 (± 0.19) corners per game. And it’s obvious that there are far fewer reawards with many games (41% - see above) having no reawards at all. The average number of reawards is 1.34 (± 0.09) corners per game but this is from a heavily skewed distribution so the average in this case is not a great measure of the central tendency.
There’s such a clear difference in the numbers that it is not even worth formally analysing. But at least we have the framework now and we can move on to the pointy end of the question.
Goal frequency and conversion rates.
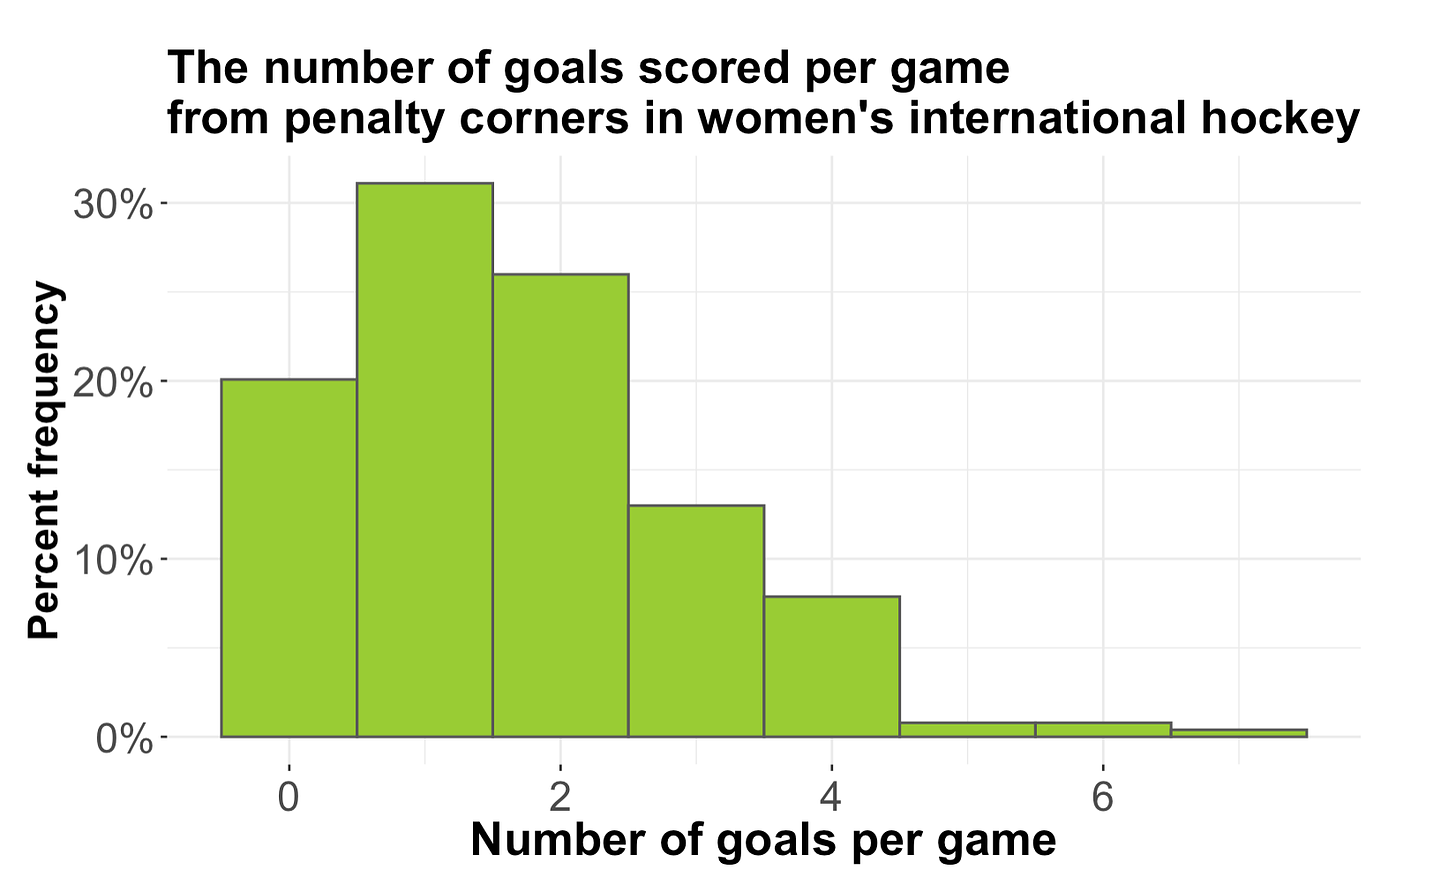
Again let’s first summarise the number of penalty corner goals that are scored in the women’s game before we delve into whether there is a difference between first and reaward corners.
Across the 254 games, 1.65 (± 0.08) penalty corner goals are scored on average every game. Given that generally about 3.7 goals are scored in the women’s game this suggests that penalty corners make up a little under half of the goals scored in the women’s game.
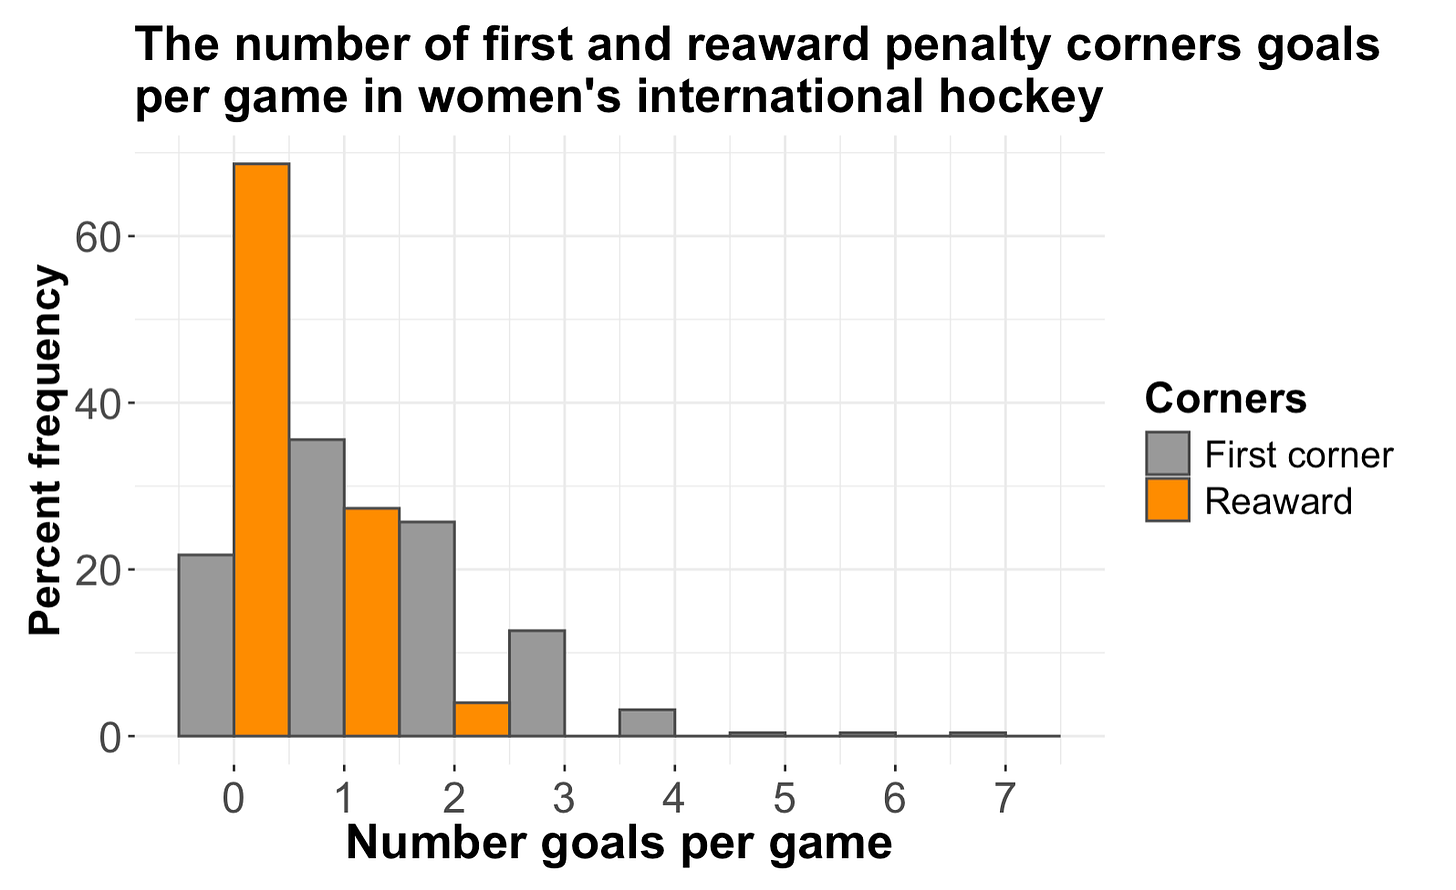
What about the comparison between the number of goals that result from first corners and reawards?
The average number of goals scored from first corners is 1.4 (± 0.074) per game and the average from reawards is 0.35 (± 0.046). There is a difference here (p < 0.001) but simply comparing the number of goals doesn’t take into account the much larger number of first award penalty corners.
The analysis
To make a proper goals scoring comparison we have to compare the proportion of goals scored from first corners and the proportion of goals scored from reawards: that is the conversion rates of the two kinds of corners.
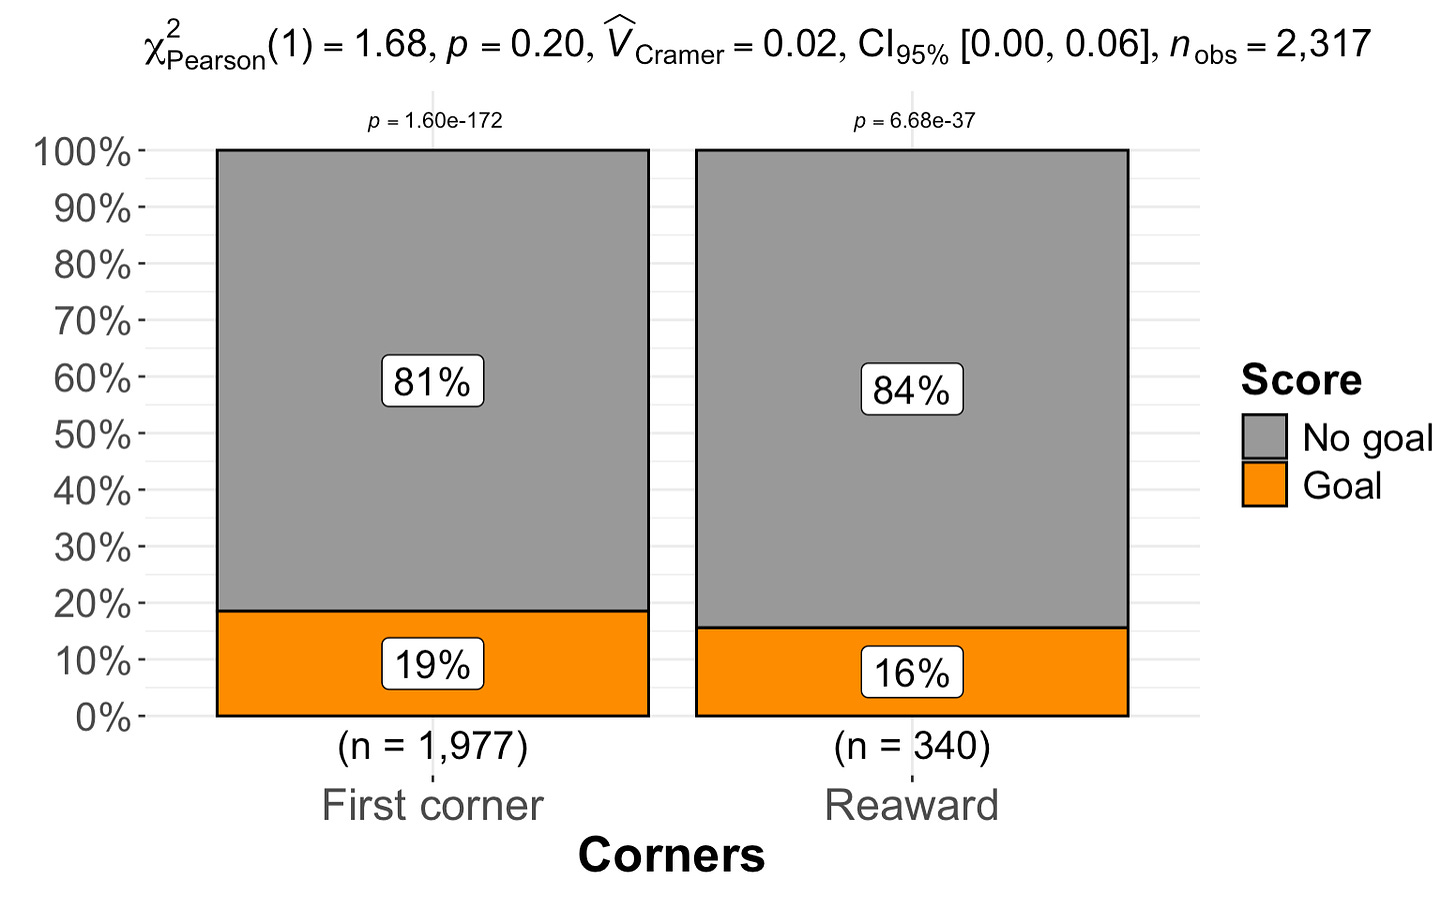
The conversion rate of first corners is 19% whereas the reaward corner conversion rate is 16%. Even though the scoring rate of reawards is slightly lower the analysis (top line above the figure) indicates that there is no real evidence of any difference in scoring rate between the two corner types (p = 0.20). There may be fewer reawards corners awarded but the probability of scoring them is neither higher not lower than the first award corners.
The conclusion is that penalty corners are like coin tosses. One penalty corner does not affect the scoring probability of the next one, even if that next one occurs immediately after the first without any intervening open play out on the pitch.
I can relax then. On match day, should the team I am coaching concede a corner and then a reaward, I can remind myself that there really is no evidence that our opponent has a higher chance of scoring this reaward than the first corner they have just failed to score. Perhaps this result will allay my twitchiness. At least in this regard.
Back to the Olympics for the next article. There are some interesting figures to show from the xG modelling and then some of the comments Katrina Powell (the Australian head coach) made on the Hockey Site’s post Olympic AMA suggest some areas that might be worth analysing in a little more detail.


